This fan blog entry was originally posted at Purple Pain Forums by MidwinterViking.
There is a path for the Minnesota Vikings to be Super Bowl contenders this year. This post takes a look at what would need to happen for that to be a reality. Some of the things might be a stretch, while others are much more likely.
Previously, I wrote a comparison of the 2022 Vikings to the Bud Grant era. There were two important conclusions in that piece:
- The Vikings’ personnel are in the range of a team that has the ability to perform at a Super Bowl level.
- The Vikings organization is outwardly showing the need to adapt to their strengths – a factor that is necessary for the type of improvement we need to see to be on a Super Bowl track.
There are two questions to answer: What does it take to get to the Super Bowl? And how do the Vikings do that?
Related: Minnesota Vikings: Projecting the 53-man roster in 2022
A closer look at points-per-game advantage
First, we’re going to dive a bit deeper into the analytics, looking at points per game as an advantage. All we’re doing is looking at points per game (PPG) based on offense and defense (rather than a simple scoring margin).
First, how much of an advantage playoff teams have gotten by scoring more points than average?
Second, how much of an advantage playoff teams have gotten by allowing fewer points than average?
Third, taking both of those advantages and adding them together to get back to a total scoring margin.
For example, if the average points per game across all teams in a season is 25 PPG, a team could have different profiles:
- Team A: scores 30 PPG (5 better than average), allows 20 points per game (5 better than average) = +10 advantage
- Team B: scores 20 PPG (equals average), allows 30 points per game (5 worse than average) = -5 disadvantage
To make this real, in 2021, the average NFL team averaged 23 (22.98) points per game.
The 2021 Vikings scored 25.0 points per game. That’s two better than average (not really great, but it’s positive, so I’ll go with “good” for now).
The Vikings allowed 25.1 points per game on defense. So, the Vikings allowed 2.1 more points than average. That’s … not so good.
To put it all together, the Vikings get +2.02 from offense and -2.08 from defense for a net season average of -0.06 (basically 0). Given that average would be 0, the Vikings happen to be the exact midpoint of the NFL.
Let’s compare them to the best, worst and competitors with this metric:
Best teams
- Patriots: +9.35 (offense +4.19; defense +5.16)
- Cowboys: +10.12 (offense +8.19; defense +1.92)
- Bills: +11.41 (offense + 5.43; defense +5.98)
Worst teams
- Texans: -10.12 (offense -6.51; defense -3.61)
- Jets: -11.41 (offense -4.75; defense -11.41)
- Jaguars: -12.00 (offense -8.10; defense -3.90)
NFC North
- Lions: -8.35 (offense -3.86; defense -4.49)
- Bears: -5.65 (offense -4.69; defense -0.96)
- Packers: +4.65 (offense +3.49; defense +1.16)
Keep those team ratings in mind as you think about where the Vikings could end up in 2022.
Related: Why one of the Minnesota Vikings’ biggest weaknesses could become a strength in 2022
Playoff and Super Bowl contender threshold
First, you might question, why am I looking at the points-per-game advantage? And how good does a team need to be to be a true Super Bowl contender?
It probably goes without saying, but there will obviously be a correlation between scoring more and doing well. The question is more about how good a team has to be to see playoff and Super Bowl results. Going back to 1998 (all starting points for measurements are arbitrary, I just picked an interesting one), here are the playoff results by scoring margin:
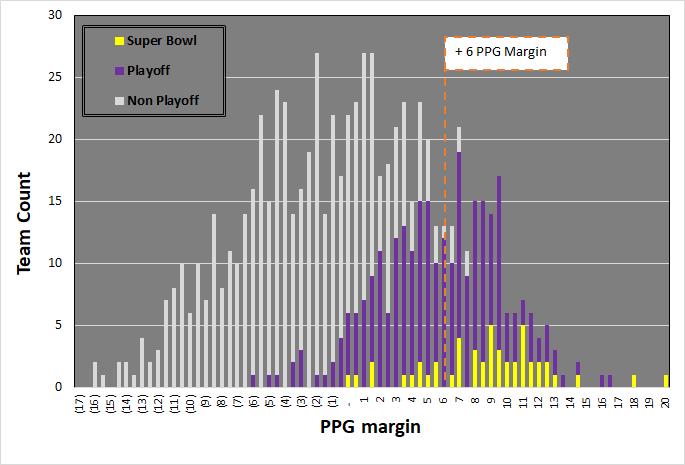
This chart is fascinating to me because it shows a few things:
1) At +6 points per game, essentially, a team would be a playoff team. Of note, 95% of this data comes from a 12-team playoff, so with 14 teams, being +6 will almost certainly punch a playoff ticket, too. It is possible to get into the playoffs by winning the right games with a much worse scoring margin, but playoffs aren’t the only goal here.
2) Most Super Bowl participants are +6 or better. There are a few worse than +6 – going all the way down to the 2011 New York Giants, who actually had a negative scoring margin. But “that one time it happened” doesn’t mean we should qualify them as a contender; that team was the exception rather than the rule. I considered cutting it back to +4.5 to +5, but that’s getting into the range where making the playoffs are no longer a very high probability.
3) Super Bowl participants are not clustered at the top of the chart; they are spread out pretty evenly from +3 to +20 points-per-game margin. I picked +6 because this seems to be where the rate of appearances really picks up. What all this means is that any team better than this +6 PPG margin is good enough to be considered a contender.
While regular season dominance corresponds with making it to the playoffs with a high frequency, getting from the playoffs to the Super Bowl is much more random. Looking at the last few years, the most dominant teams have actually not made the Super Bowl:
2021
- Most dominant teams: Bills (+11.4) and Cowboys (+10.1)
- Super Bowl teams: Bengals (+4.9) and Rams (+5.1)
2020
- Most dominant teams: Ravens (+10.3) and Saints (+9.0)
- Super Bowl teams: Bucs (+8.6) and Chiefs (+6.9)
2019
- Most dominant teams: Ravens (+15.6) and Patriots (+12.2)
- Super Bowl teams: 49ers (+10.6) and Chiefs (+8.9)
2018
- Most dominant teams: Saints (+9.4) and Chiefs (+9.0)
- Super Bowl teams: Rams (+8.9) and Patriots (+6.9)
Related: Predicting NFL playoff bracket and Super Bowl 2023 winner
What about the offense versus defensive breakdown?
Is it necessary to be good at one or the other?
In sum: not really. 2021 had more offensive fireworks, but 2020 produced a great set of examples:
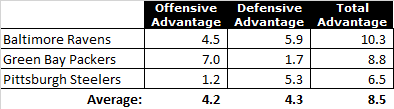
2020 scoring advantage:
The Ravens were a balanced team, the Packers were driven by offense and the Steelers were driven by defense; all three had the profile of a Super Bowl contender.
Looking at past Super Bowls, I took “offensive advantage” minus “defensive advantage” to see if offense or defense showed up more in the Super Bowl. Note: on this chart, it is not good or bad to be high/low/middle; it only shows which side of the ball was more dominant getting to the Super Bowl.
- Elite offense – average defense = positive number
- Average offense – elite defense = negative number
- Balanced offense – balanced defense = close to 0
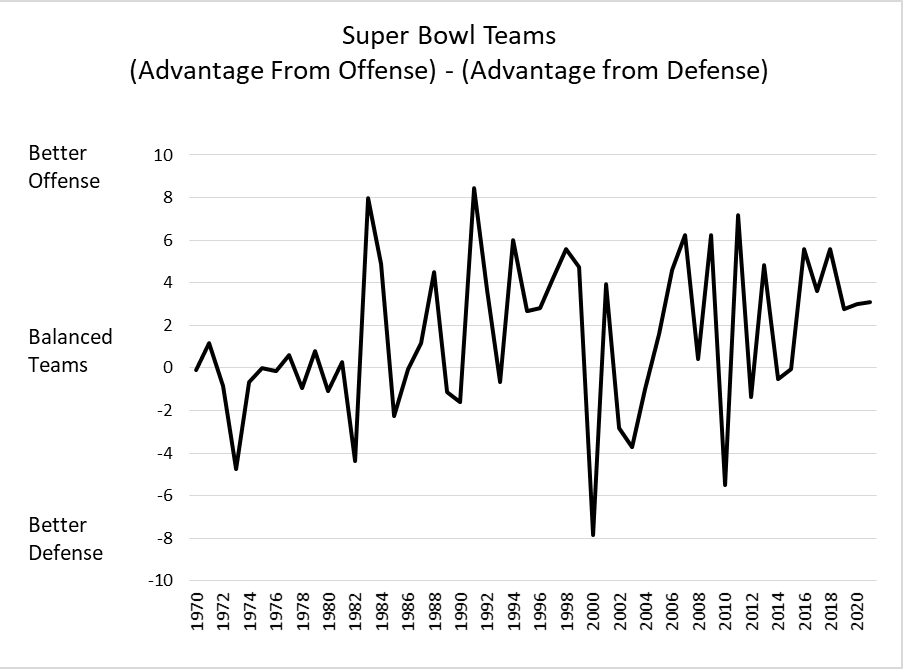
This is averaged between both Super Bowl participants. Teams with strong offenses show up more often, but there are plenty of examples of balanced and defense-heavy games. It’s enough for me to say: +6 PPG advantage counts, no matter if it comes from offense or defense.
One last question: Why use points-per-game scoring margin as a measuring stick instead of wins?
The answer is because almost all playoff teams end up with 10-13 wins; there isn’t enough variation to tell who is a paper tiger versus a real contender. Wins on their own also don’t tell us anything about offensive or defensive performance and what might impact changes (i.e. the 2000 Ravens and 2018 Chiefs both had 12 wins, but were built very differently). One or two wins or one or two losses can be luck; that changes the metrics a lot for win % but not scoring margin. Check out the correlation between scoring and winning:
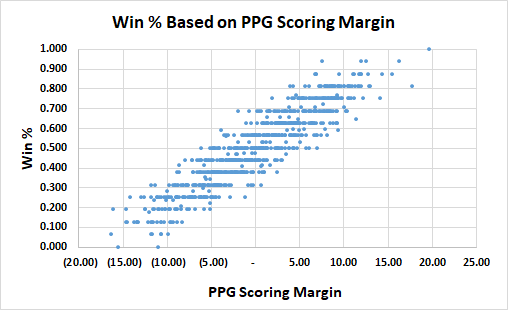
Almost every win percentage has at least a 10 points-per-game range of scoring differentials. At .500, there are such teams as the 2019 Dallas Cowboys (#1 overall offense and #9 overall defense), right there alongside the 2013 New York Jets (hello, Geno Smith and your 40-point loss to the Andy Dalton-led Bengals); those two teams look the same in terms of record, but very different when it comes to scoring margin by offense and defense. Points per game also explains why it is not at all surprising that the 2021 Packers finished their season face down with a mouth full of frozen Lambeau worms (they were one of the worst teams with a .750+ win percentage).
Related: Minnesota Vikings trade for Nick Mullens from Las Vegas Raiders
How do the Vikings get to this +6 PPG differentiation?
This is the money question. And that means this section is the part where different opinions on the team will get you to different results.
Using 2021 as a starting point, the Vikings were almost exactly average.
- Advantage from offense: +2.02
- Advantage from defense: -2.08
- Total disadvantage: -0.06 (0.00 would be perfectly average)
For me to think of the Vikings as a Super Bowl quality team, I need to find 6.06 points per game (rounding to 6) of improvement. Obviously I can just make things up, so the interesting question at each of these steps has to be: Is this a thing that could reasonably happen?
Fewer three-and-outs
The first thing I looked at was one of the biggest weaknesses on offense: a huge number of three-and-outs. Not to derail things with a deep analysis of drives, but if the Vikings could eliminate a single three-and-out per game and convert it to an average drive (about 30 yards), that would help them gain about 25 more yards per game or +425 yards on the season. The first step in my process will be to convert those 425 yards (or 25 per game) to points.
To do this, I looked at the correlation between points and yards for teams over the last 10 years (the 2021 Vikings are highlighted):
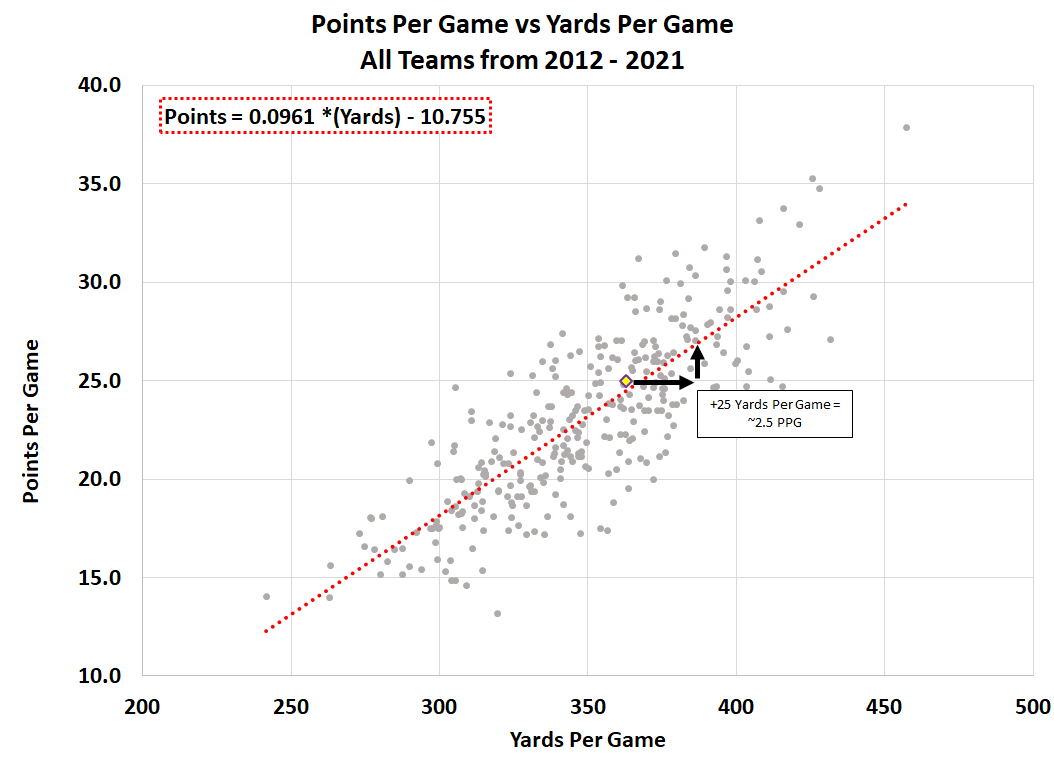
Note: the formula 0.0961 * Yards – 10.755 works out to +/- 10.4 yards per game = +/-1 point per game. For this post I’m rounding that to 10 yards per game = 1 point per game as close enough.
If simply avoiding a single three-and-out per game is worth around 25 yards per game, that is 2.5 points per game, I can decide if that seems like a realistic target. What if they don’t do quite that well? What if the drives are better? I’ll give this a range:
The Vikings could have one fewer three-and-out per game = +1.5 to 3 PPG.
This works for other things, too. You can look at all kinds of impacts and see what the difference might be.
For example, check out what happened to the completion percentage for the last two quarterbacks when they started running a Kevin O’Connell offense:
- Jared Goff‘s year prior to O’Connell: 62.9 completion %
- Goff’s first year with O’Connell: 67.0 completion %
- Goff completion % improvement with O’Connell: +4.1%
- Matthew Stafford‘s year prior to O’Connell: 64.2 completion %
- Stafford’s first year with O’Connell: 67.2 completion %
- Stafford’s completion % improvement with O’Connell: +3.0%
At the time, these were career highs for both players.
Could Cousins see that kind of improvement? In 2021, Cousins had a 66.3 completion percentage. If I take Stafford’s improvement and give him +3.0%, that’s 69.3%; Cousins has already had two years higher than that – one with the Vikings, so this is definitely possible.
A 3% improvement on 550–600 passes a season is an extra 15-20 completions; at 11.5 yards-per-completion (Cousins’ career average), that’s in the range of 150-200 yards. Convert that to points and get another possibility:
A 3% higher pass completion rate = +1.5 to 2.0 PPG.
Fewer penalties
Penalties have an impact… and by penalties, I really mean Oli Udoh. Udoh had 12 holding penalties; for example, Jesse Davis or Chris Reed at right guard have averaged 1-2 per season. Cutting off 10 holding penalties is 100 yards per season, over 17 games, that’s a little over five yards per game or 0.5 PPG.
Less holding from Oli Udoh = +0.5 PPG.
This post is the reason I did an entire series looking back at games from 2021 (2021 Review – Game 11 @ SF – this piece includes links to others). I was looking for trends that could be changed without needing players (Cousins, Cook, Jefferson, Thielen, offensive line) to perform at a significantly different level than they did last season – i.e. how could a new coaching staff put players in a better position to succeed?
This play is my personal nomination for worst offensive play of the season; there were a lot of plays designed like this (if you don’t believe me, check out the 2021 game reviews in the previous link) but the situation takes it over the top. This was first-and-10 after the Vikings got a turnover in overtime, so any score wins:
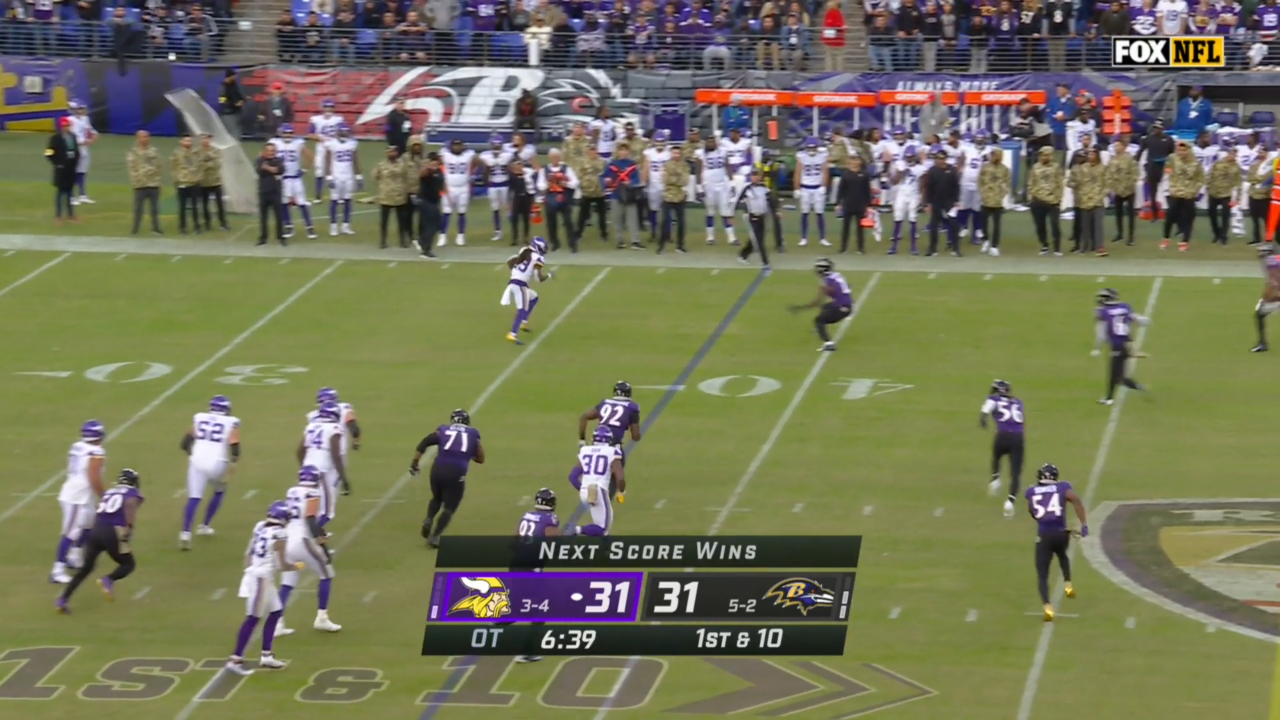
This was a designed swing pass to Cook, who caught the ball about seven yards deep in the backfield. To make a play, Cook was then left on an island versus far too many Ravens defenders. There was no blocking, no deception, no deep shot, no receivers running routes to a different side of the field to pull defenders away… just toss it to Cook and hope he beats six defenders on his own. The question is: Can I both quantify and justify a change to scoring?
Related: 2021 first-round pick Christian Darrisaw drawing rave reviews during Minnesota Vikings camp
Quantifying
The Vikings averaged 5.7 yards per play last year; Kevin O’Connell’s Rams averaged 6.0 yards per play. League average was 5.4 yards per play. Over the course of slightly over 1,000 plays, if the Vikings improve from 5.7 to 6.0 yards per play, that’s a bit over 300 total yards, or close to 20 yards per game, which would be approximately +2 points per game.
Does this seem realistic? Well, 20 yards per game would be the equivalent of 2-4 negative plays per game being turned into positive plays of 6-8 yards. A second test for plausibility, this change on its own would make the Vikings the #7 offense by 2021 standards. Given the number of horribly ineffective plays per game, and the high per-play efficiency of the Rams’ offense, this seems realistic.
With the offensive talent the Vikings have, I think it’s possible the Vikings could match (or even outperform) the Rams in terms of total offense. The Vikings could also regress towards league average. Since play efficiency over an entire season has a lot of variables, I’m going to give this a large range of possible outcomes.
Changes in play design and play calling= -1 to +2.5 PPG.
Defense
Remember the defense allowed more points than the NFL average, so compared to 2021, they are starting from a negative two points per game. Looking first at the impact of injuries. I’m going to take the season with Danielle Hunter versus without him. Hunter wasn’t the only injury, but his injury was significant.
- Vikings’ season average: 25.0 PPG
- Vikings’ defense with Hunter: 22.4 PPG (including his partial game)
- Vikings’ defense without Hunter: 26.9
The Vikings playing the entire season at a “with Hunter” level due to having a combination of Hunter and Za’Darius Smith pass rushing would be an improvement of 2.6 points per game. Is this realistic? 22.4 points per game would have made the Vikings the #18 scoring defense in 2021; a three-point improvement would only move the Vikings up to the #17 defense. That passes as realistic to me; this is not suggesting that Hunter coming back would suddenly make the unit a top 5 unit.
Improved pass rush: +2 to 3 PPG.
Now the big one: How will the Vikings perform in the last two minutes of halves? There is a lot of data here:
The Vikings allowed a massive 128 points in the last two minutes of each half. That’s out of 426 points allowed total. This is a highly complex issue that includes injuries, play calling, performance of many players and some bad luck. So rather than point to a single stat, for the purpose of this calculation, I’m looking at three ways to figure out what a reasonable expectation is.
Method one – breaking that down in terms of rate of scoring that is:
- -last two minutes of each half: 1.9 points per minute allowed
- -the other 56 minutes of game time: 0.3 points per minute allowed
If the Vikings had maintained the same scoring rate of 0.3 from the first 28 minutes of a half for the entire game, that would work out to 320 points allowed. That results in the No. 3 scoring defense; that’s unlikely, but if it did happen, the defense would be about six points per game better.
Method two – split points up:
Guess that one-third of those 128 points are still scored, just slightly before the two-minute warning. One-third of the 128 points allowed are still scored in the last two minutes. One-third of the 128 points are prevented. That works out to a +2.5 points-per-game improvement.
Method three – assume the defense allows points at the same rate as the offense scores points in the last two minutes.
The Vikings did an okay job scoring in the last two minutes of halves, but they were outscored by 81 points. That 81-point difference over 17 games is 4.7 points per game.
After being historically bad, some regression towards the mean is almost certain in this category. I think realistic is on the low-to-middle range of this scale, but two-minute drills can be fluky.
Improved late-half scoring defense: +2.5 to 6.0 PPG.
Related: Overpaid or underrated: 2022 outlook for Vikings QB Kirk Cousins
How does this get the Vikings to a Super Bowl?
The purpose of all of this was to see if there were opportunities to improve the team. Getting a great team isn’t a matter of adding a single transcendent player, unless that player is Randy Moss and [checks depth chart] he’s not playing. To perform at a high level, the Vikings will need to work on a lot of little things.
Don’t just add all these numbers up (some of you will, and that’s okay; I just had to warn you so I can say I warned you not to). There is certainly an overlap in some these numbers (i.e. Cousins’ completion % versus play efficiency). That said, there may also be synergies not captured in a simple measurement of a single number, i.e. a more efficient offense keeping the defense off the field. That said, it’s worth looking at these opportunities to improve a points-per game-margin in aggregate:
- The Vikings could have one fewer three-and-out per game = +1.5 to 3.0
- A 3% higher completion offense = +1.5 to 2.0
- Less holding from Oli Udoh = +0.5
- Changes in play design and play calling = -1.0 to +3.0
- Improved pass rush: +2.0 to 3.0
- Improved late-half scoring defense: +2.5 to 6.0
[Frantically adds up numbers 3+2+.5+3+3+6 = +17.5] Hey! What was the scoring margin for the 1998 Vikings? +16.56! SWEET! Super Bowl, homeboy!!! There, I knew it was going to happen! I just saved you some time…
This is not suggesting the Vikings will have a +17 points-per-game scoring margin. This is suggesting there are a lot of ways the team can improve into that Super Bowl contender sweet spot of +6 (or better) points per game.
Related: Super Bowl odds: Every team’s championship futures for 2022-23 NFL season
Is this realistic?
I’m sure there are other opportunities (and also risks i.e. regression on deep-ball passing). The point is that the possibility is there and not as crazy as it might seem. Each of these things is realistic on its own, but it is also important to look at these in aggregate and see if they still make sense.
Let’s look at the offense first. If I assume between play calling, avoiding three-and-outs and passing efficiency, the Vikings improve by three points per game. Add that to the +2.0 per game, that would put the Vikings at about a +5 PPG advantage.
Compare that to the 2021 season and the Vikings would:
-have a slightly better offense than the 2021 Patriots (+4.2) and 2021 Chargers (+4.9)
-be not quite as good on offense as the 2021 Chiefs (+5.3) or 2021 Bills (+5.4), and well below the 2021 league-leading Buccaneers (+7.1) and Cowboys (+8.2).
Saying the Vikings could outscore the 2021 Chargers isn’t a huge stretch; this would put the Vikings on the fringe of a top five offense.
The defense is more difficult because the range of possible outcomes is so much larger. However, it becomes easier to justify if I take the low end of changes. Between maintaining an improved pass rush and not collapsing completely at the end of halves, I will say the Vikings can improve by 3.5 points per game.
I picked 3.5 because it is on the low end of the range for end-of-half improvement; in addition, it’s only a single point-per-game improvement due to health (well below the calculated 2-3 point range) – meaning it can still happen if there are some injuries.
This would take a negative Vikings defense from 2021 (-2.0) and change it to a slight positive (+1.5). In 2021, there were four teams that had a defense that performed about this well: Arizona Cardinals, Seattle Seahawks, Indianapolis Colts, and the San Francisco 49ers.
Is that comparison realistic? The 2021 Cardinals, and Colts seem like good targets, but the Seahawks (I thought they were bad) and 49ers (I thought they were better), do not.
Side-track investigation: The Seahawks and 49ers were both significant outliers in the points versus yards allowed in opposite ways. 49ers allowed a lot more points than expected (3rd in yards versus 10th in points); Seahawks somehow allowed fewer points than expected (28th in yards versus 11th in points). Because they are such outliers, I’m taking them out of the comparison.
With just the 2021 Cardinals’ and Colts’ defenses left as comparison points, this looks a lot more realistic. That would be claiming the Vikings can be in the top half of the league, but outside the top 10 on defense.
In aggregate, this would leave the Vikings with a scoring advantage of +5 on offense and +1.5 from the defense, for a total team score of +6.5 – meeting the Super Bowl threshold.
There are many other ways the Vikings could score more/fewer or allow more/fewer points. None of these metrics or changes have a 100% chance of happening (they could go negative instead of positive). However, this does show the sort of thing that would need to happen for the Vikings to be a Super Bowl team. You can decide how realistic those outcomes are or if you would add other changes to the team’s PPG +/-.
If you’ve enjoyed this piece, consider hopping over to Purple Pain Forums and debating with other Minnesota Vikings fans about not only this topic, but so much more!