
 Isaac Ciravolo
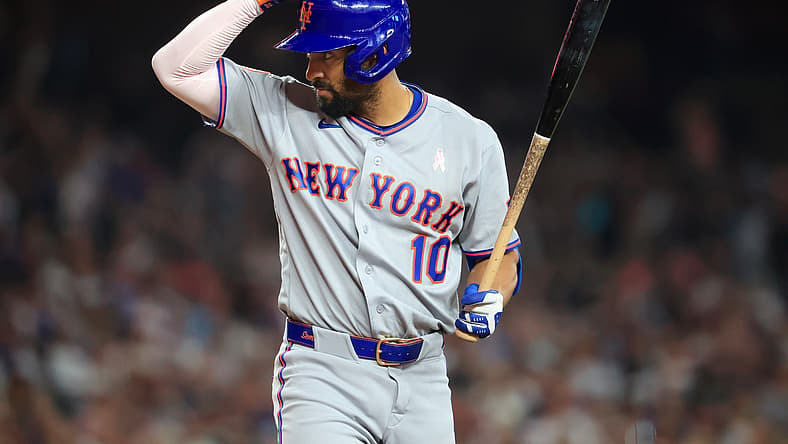
Just over two months into the 2026 MLB season, the Automated Ball-Strike (ABS) challenge system has moved past its novelty phase. The days of players looking back and arguing to the umpires out of pure frustration are gone. Now, we have a quantifiable skill to add even more complexity to this game. For data-driven front offices, the Hawk-Eye camera system hasn’t just changed the strike zone, it has created a brand new market to judge and train players on.
Just as pitch framing and shifting revolutionized run prevention in the 2010s, the ABS system is affecting many parts of the game in both expected and unexpected ways.
Empirical Wins vs Expected Wins
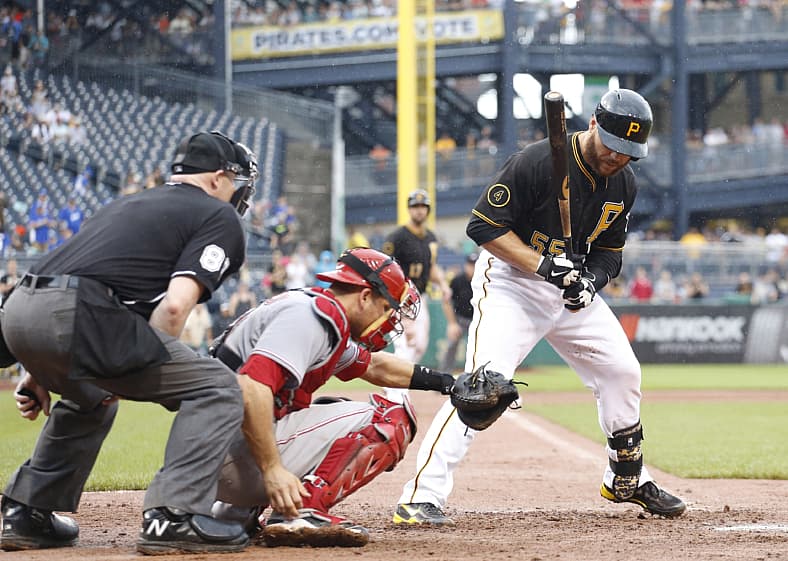
Pythagorean Win Expectancy takes runs scored and runs allowed to determine an “expected” number of wins. Because ABS challenges directly alter run-scoring environments, flipping a 2-out strikeout into an inning-extending walk or negating a rally with a called strike three, they immediately skew a team’s actual run differential. ABS affects the runs scored and allowed without forcing a team to buy or find new talent.
This creates a phenomenon where teams are outperforming or underperforming their expected Pythagorean wins strictly based on their ABS challenges.
Teams like the St. Louis Cardinals and Chicago White Sox are outperforming their expected win-loss (EXWL) and are both tied for second most runs gained vs expected from ABS. On the flip side, the Texas Rangers and the Detroit Tigers are both underperforming their EXWL as a result of being the two worst teams in the league for runs gained vs expected.
Hitters vs Pitchers
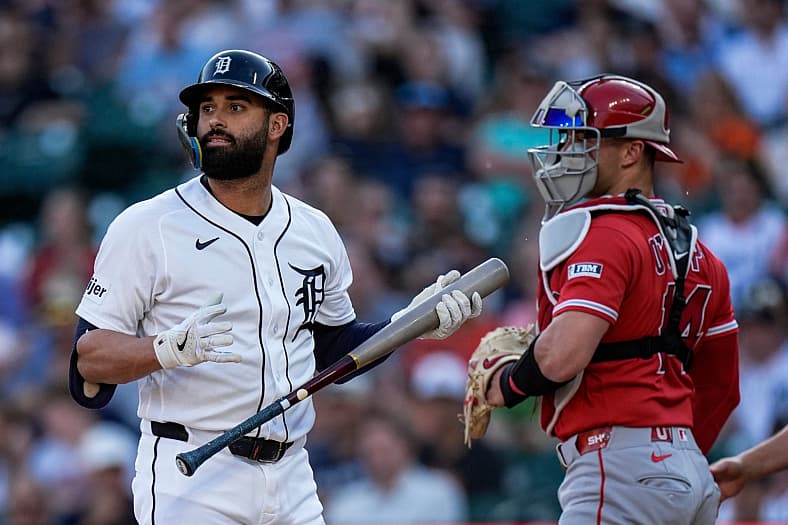
League-wide, Statcast data shows challenges are successful 43% of the time, but two parties can challenge pitches: batters and fielders. The fielder party (pitchers and catchers but mainly catchers) has a higher challenge win-rate of 47%, while the batters have a successful challenge rate of 39%.
But why is this? Why are the guys standing right next to the plate struggling so much? It comes down to physics and bias.
The Physical Aspect
Hawk-Eye upgraded its cameras to 300 frames per second this season, and it grades the zone at the exact 8.5-inch midpoint of home plate. A hitter is standing alongside the plate, perpendicular to the plane of the two dimensional ABS strike zone. It is much harder for a batter to tell the depth of the baseball, or how close or far to himself, to the tenth of an inch required to win an ABS challenge.
Conversely, the catcher is parallel to the plane of the ABS strike zone. Being parallel to the plane allows catchers to see exactly where the ball crossed the plane, without the depth blind spot that ails batters. Since batters and catchers are more or less the same distance from the ABS strike zone, the parallel versus perpendicular distinction makes the difference between successful ABS challenges for each group.

Image via MLB
The Emotional Aspect
Furthermore, hitters and pitchers (though pitchers often just rely on catchers to challenge) are more emotionally driven. This happens because their main stat lines are reflective of the outcomes of the pitch. A batter doesn’t want to strikeout and a pitcher doesn’t want to walk the batter, but the catcher doesn’t care either way.
It is also important to note that because batters have more reason to challenge or feel that they can affect the game more with a challenge, they challenge at a rate over four times as much as fielders. However, they have less than a third of the runs gained vs expected compared to the fielders.
Big vs Small-Market
It is no coincidence that the teams maximizing this new edge are operating with smaller payrolls. Of the top five in challenges, their 2026 payroll ranks are,
| Team | Challenges Attempted Rank | Payroll Ranking |
| White Sox | 1st | 28th |
| Rockies | 2nd | 21st |
| Twins | 3rd | 22nd |
| Athletics | 4th | 26th |
| Royals | 5th | 18th |
The Los Angeles Dodgers are the lone outlier in the top ten. They rank ninth in challenges and second in payroll, but this follows their top-notch analytical department more typical for small-market teams.
Now to look at the bottom of the challenges leaderboard, the bottom three teams all rank in the top ten for payroll:
| Team | Challenges Attempted Rank | Payroll Ranking |
| Blue Jays | 30th | 4th |
| Mets | 29th | 1st |
| Tigers | 28th | 10th |
These teams have also seen some unexpected failures during the early third of this season. Prior to the season starting, these teams were in the top ten to make the playoffs with the Blue Jays having the worst chance at 53%. On May 29, none of these teams are in the top ten. The Blue Jays are still close at 11th, but the Tigers and New York Mets are at 21st and 23rd respectively.
Perhaps unexpectedly, ABS has not yet proved to be influential in the outcomes of games, only game situations. But it has acted as a sign and is correlated to underperformance of preseason projection. especially for big-market teams.
The Competitive Edge
As we push toward the All-Star break, the knowledge around ABS will grow and the disparity between those who take advantage of it and those who don’t will grow as well. ABS is no longer truly new to the league and teams are already establishing themselves as more aggressive or more cautious users.
While there is not a clear connection between aggressive use of ABS and winning above expectations, there is evidence that using it when most opportune can give small-market teams a chance against the top spenders. The opposite is true as well. When a big-market team fails to understand when to use ABS, their payroll advantage lessens.
In this environment with less human error, teams that take advantage of trying to quantify the new ability of ABS challenging will have a better chance at winning the next World Series. Teams that rely on the “feel” of challenging are going to keep losing challenges and games by the fractional run value that comes with each challenge.